Python获取基金信息

背景
目前市面上有大量的基金交易平台,除了传统的银行渠道,还有很多互联网金融平台。在最早期的时候,各家的申购手续费并不一致,可以购买的产品也不一样。这就导致了几年下来,我的基金遍布了三大平台,每次检查收益情况和资金分布,都要跨多个平台,操作起来非常麻烦。久而久之,对自己的投资情况都已经混淆不清了。
于是,打算做一个能够整合自己的投资情况的工具,基金数据的整理就先试一下水。采用了akshare作为基金当前数据来源,工具整合整理并制表输送到邮箱中。(当然,最靠谱的方式无异于自动登录各大平台,并获取账户的投资信息汇总,只是各大平台并不提供接口,且数据形式各异,整理起来也非常困难,所以选择了外部数据源的方式。)
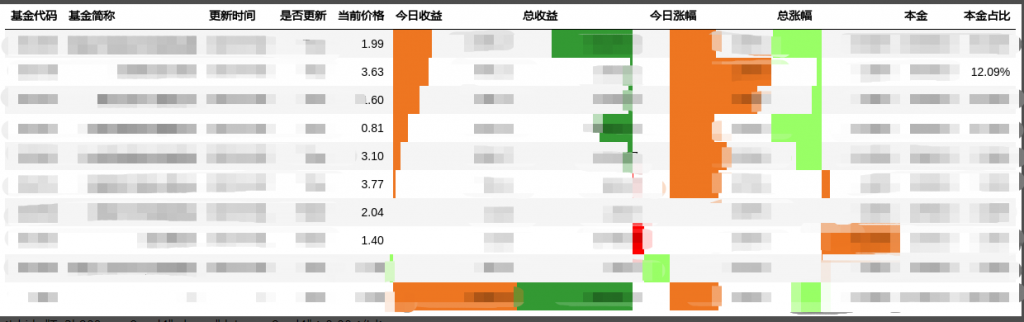
最终效果
实时获取当前的基金价格,并计算出投资的收益,生成图表并发送到邮箱中。
实现
python小脚本实现,基于 akshare + dataframe_image 库完成。也调研了下tushare,但是这个积分机制让我望而却步,就先不用了。理论上,akshare完成的工具其实更像是数据清理,他本身并不做数据的存储,所以每次发起请求,都是直接到目标地址上拉取数据,并本地整理返回。这就注定了akshare的处理耗时很高,单个接口的处理耗时可能到10s+,用来做量化,恐怕有点难了。而tushare,理解上是会自动采集数据,并缓存在服务上,供调用方使用。接口的处理耗时比akshare要好很多。但也因此,需要服务器成本,带宽成本,价格不菲,也就需要这个积分机制来维持。
目前我只是小试牛刀,且功能上对时效性要求并不高,可以接受分钟级别的延迟,akshare自然更适合我一些。
由于在我的电脑上,并没有利索的python环境,所以临时配置了下python环境,使用pyCharm作为IDE。(事实证明,这并不是一个好主意)
使用了fund_open_fund_daily_em接口,直接把全部的基金信息拉回来处理。这里面的数据结构我并不熟悉,也浪费了大量的时间在查接口上。不过幸好用的pandas的数据结构,学起来也不算复杂,也算为后续的累积点经验了。
# get_hold_status 通过获取购买的基金的最新数据,与本金数据对比,生成DataFrame表格
def get_hold_status(my_holds):
    all_fund_daily = ak.fund_open_fund_daily_em()
    indexed = all_fund_daily.set_index("基金代码", drop=False)
    status = []
    all_total_price = 0
    today_all_earn = 0
    yesterday_all_earn = 0
    for code in my_holds.get_holds_code():
        try:
            fund_info = indexed.loc[code]
        except BaseException as e:
            util.log("get %s fund info failed" % code)
            util.log(e)
            continue

        hold_info = my_holds.get_hold_info(code)
        total_invest = my_holds.get_total_investment()
        row = {
            "基金代码": fund_info.loc["基金代码"],
            "基金简称": fund_info.loc["基金简称"],
            "更新时间": get_date_from_column_name(indexed.columns[2]),
        }
        yesterday_price = float(fund_info.iloc[4])
        if fund_info.iloc[2] != "":
            today_price = float(fund_info.iloc[2])
        else:
            today_price = yesterday_price
            row["更新时间"] = get_date_from_column_name(indexed.columns[4])
        row["是否更新"] = fund_info.iloc[2] != ""
        row["当前价格"] = today_price
        row["今日收益"] = (today_price-yesterday_price) * hold_info["share"]
        today_all_earn += row["今日收益"]
        yesterday_all_earn += yesterday_price * hold_info["share"]
        row["总收益"] = today_price * hold_info["share"] - hold_info["total_money"]
        row["今日涨幅"] = (today_price - yesterday_price) / yesterday_price
        row["总涨幅"] = row["总收益"] / hold_info["total_money"]
        row["本金"] = hold_info["total_money"]
        row["本金占比"] = hold_info["total_money"] / total_invest
        all_total_price += today_price * hold_info["share"]
        status.append(row)

    status.append({
        "基金代码":"总计",
        "基金简称":"---",
        "更新时间":"---",
        "当前价格":0.0,
        "是否更新": True,
        "总收益":all_total_price - total_invest,
        "本金": total_invest,
        "总涨幅": (all_total_price - total_invest) / total_invest,
        "今日涨幅": today_all_earn /yesterday_all_earn ,
        "今日收益":today_all_earn,
        "本金占比":1.0,
    })

    # 这里并不采用DataFrame的汇总,而是手算了一个,主要是我的汇总信息相对复杂
    return pd.DataFrame(status[:len(status) -1]), pd.DataFrame(status[len(status) - 1:])
接下来,是将DataFrame的数据美化成图表输出。这里研究了很久,这篇文章给了我极大的帮助:
    pd.set_option('display.max_rows', None)
    pd.set_option('display.width', 5000)
    pd.set_option('display.unicode.ambiguous_as_wide', True)
    pd.set_option('display.unicode.east_asian_width', True)

    pd.options.display.max_columns = None
    my_hodls = myfunds_config.MyFundsInfo()
    status, total = get_hold_status(my_hodls)
    status.sort_values(by='今日收益', inplace=True, ascending=False)

    status = status.append(total, ignore_index=True)

    styler = status.style.hide(axis='index')\
        .format({'今日收益':'{0:.2f}', '今日涨幅':'{0:.2%}', '总收益':'{0:.2f}', '总涨幅':'{0:.2%}', '当前价格':'{0:.2f}', '本金':'{0:.1f}', '本金占比':'{0:.2%}'})\
        .bar(subset=['今日涨幅', '总涨幅', '今日收益'], color=['#99ff66','#ee7621'], align='mid') \
        .bar(subset=['总收益'], color=['#339933','#FF0000'], align='mid')
输出成png图片保存
import dataframe_image as dfi
# 注意这里是styler
dfi.export(styler, "test.png")
发送邮件(带附件)
import os.path
import smtplib
from email.mime.text import MIMEText
from email.mime.multipart import MIMEMultipart
import util


class EmailSender:

    def __init__(self, account : str, pwd : str):
        self.account = account
        self.pwd = pwd
        self.inited = False
        self.att_list = []
        try:
            self.smtp = smtplib.SMTP_SSL("smtp." + account.split("@")[1], 465)
            self.smtp.login(self.account, self.pwd)
            self.inited = True
        except BaseException as e:
            util.log(e)

    def attach_file(self, file_name: str):
        att = MIMEText(open(file_name, 'rb').read(), 'base64', 'utf-8')
        att['Content-Type'] = 'application/octet-stream'
        att['Content-Disposition'] = 'attachment;filename=%s'%(os.path.basename(file_name))
        self.att_list.append(att)

    def send_mail(self, to: str, subject: str, content: str):
        if not self.inited:
            util.log("smtp not inited!")
            return False
        msg = MIMEMultipart()
        msg.attach(MIMEText(content, 'plain', 'utf-8'))
        for att in self.att_list:
            msg.attach(att)
        self.att_list = []
        msg['Subject'] = subject
        msg['From'] = self.account
        try:
            self.smtp.sendmail(self.account, to, msg.as_string())
            return True
        except BaseException as e:
            util.log("send mail failed")
            util.log(e)
            return False
最终,将流程串起来,每5分钟拉取一次信息对比是否发生变化,如有变化,发送邮件。将其部署到服务器上,持久运行。
问题
Windows上开发,Linux上部署
由于这两个平台的差异比较大,python的某些库兼容性并不是很好。加上两边我都需要初始化一遍环境,所以在调试环境的时候遇到了很多问题:
- linux服务器选啥:腾讯云轻应用-广州机房
- 代码托管:开始并没有考虑这个问题,后来感觉很有必要。采用腾讯云coding平台。
- 远程开发? 由于本地的终端并没有好用的上传方式,最终还是选用了熟悉的vscode远程开发模式。
- dataframe_image输出中文乱码:这是因为linux服务器上没有安装中文字体库。
- 需要chrome:dataframe_image默认采用的是chrome的screenshot方式渲染表格生成图片。要求机器上需要安装chrome。在我的Windows机器上没啥问题,Linux上安装chrome就需要手动安装了。
wget https://dl.google.com/linux/direct/google-chrome-stable_current_x86_64.rpm
sudo yum install ./google-chrome-stable_current_*.rpm
一些思考
以前自己写一个小工具,想起什么就开始搞。这次走了很多弯路。
- 代码托管,项目计划,wiki,CI/CD 是需要考虑好的。在小工具上可以尝试使用Serverless的方式来做,容器化部署的模式也可以做进一步探索,尽量使用市面上成熟的产品,不要过多依赖闭源能力,这样也是对自己能力的锻炼。
- vscode 远程开发模式必须坚持。申请机器,还是第一步把开发环境定好。
- python的代码规范,提示兼容,文档化。以前我写c/c++从不考虑这些问题,现在工作上用了很多golang,也觉得对于维护代码质量,多人协同开发下,规范是必然的。目前我对于Python这块是空白,还有很多写法也不能确认是否最佳实践,有必要研究下。
后续我会继续维护这个个人项目,将股票的信息整合进来,尝试做简单的分析。
Related Posts
2025 用Cursor不如用国产大模型自己搭建!VSCode+Continue教程

2025年,建议将AI工具链全面切换至DeepSeek